
The market is starting to reveal where its real strengths – and real weaknesses – really lie.
After several sessions filled with unsuccessful breakdowns, recaptured gaps and aggressive counter-attacks from both sides, the metals market is entering a much more technical phase. The “easy” directional moves are behind us for now, and what happens next will likely be decided around some key levels that are acting like a magnet for the price.
US Dollar Index (DX.F)
The first thing that immediately stands out on the charts is yesterday’s island reversal – a bearish formation that invited sellers back into the field and triggered another test. Major short-term support area (97.56-97.82) Based on the bullish divergence since the beginning of March.
But here’s the important thing: Despite the pressure, that support once again held.
And not just barely. The market defended the area for another session, showing traders that this area still mattered and that was enough to bring buyers back for a counterattack.
By the end of the day, the price managed to close back above the upper edge of the gap. Nevertheless, the bearish message from the candlestick formation has not disappeared. It is still looming over the market like a warning signal.
That is why today’s session is so important.
We are seeing another attack on support right now, and today’s close may tell us who is really in control:
Will the Bulls once again come to the defense of their key ally?
Or will the bears eventually break the floor beneath them?
And this is where traders should pay extra attention.
If that bullish gap closes completely – especially considering Daily Stochastics is already flashing a fresh sell signal – the first downside target for bears becomes the 61.8% Fibonacci retracement around 97.36 or even the next support area between 96.82 and 97.02.
Main levels to watch:
Supports: 97.56-97.82 (green support zone) / 97.36 / 96.82-97.02
Resistance: 98.20-98.31 / 98.75-99.68 / 100
gold(gc.f)
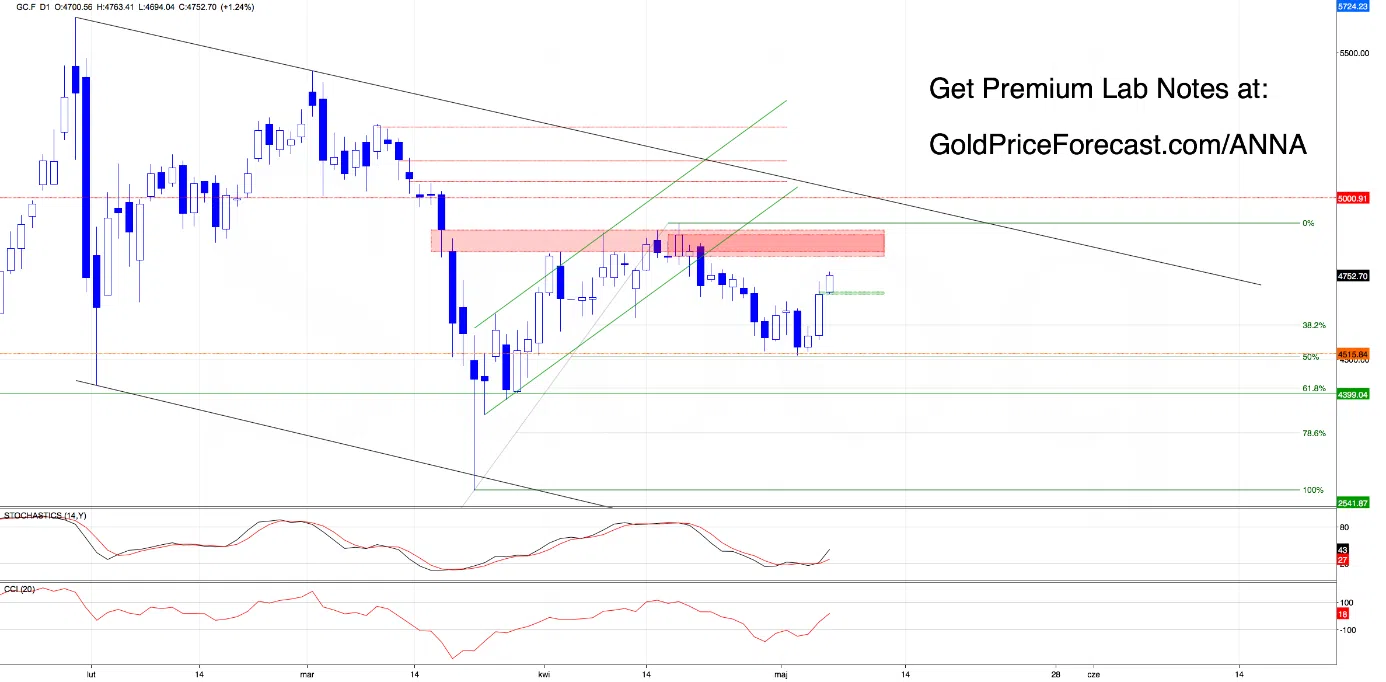
let’s start tuesday quote: :
“(…) Bullish scenario:
If buyers manage to break above 4595, the path opens towards the previously mentioned resistance zone – around 4680. But getting there is one thing… winning the battle in that area is an entirely different story. This is where the real test begins: Can buyers really invalidate the island reversal and the earlier breakdown under 4686? (…)”
From today’s perspective, we see that the Bulls handled business almost flawlessly.
just didn’t do it The price reached our upper target (Many congratulations to all those who followed the bullish scenario and made profits), but buyers also managed to close the session above the earlier island reversal formation, effectively neutralizing its bearish implications.
And technically this is a big deal.
Furthermore, yesterday’s session ended above the previously broken 4686 resistance level, meaning the earlier breakdown we have now is invalid.
in simple terms? The market trapped the late bears and shifted the momentum back to the buyers.
This combination of bullish technical factors along with fresh daily buy signals from indicators led to the creation of a new bullish gap Today between 4694 and 4700, which now serves as the nearest support zone.
Palladium (PA.F)
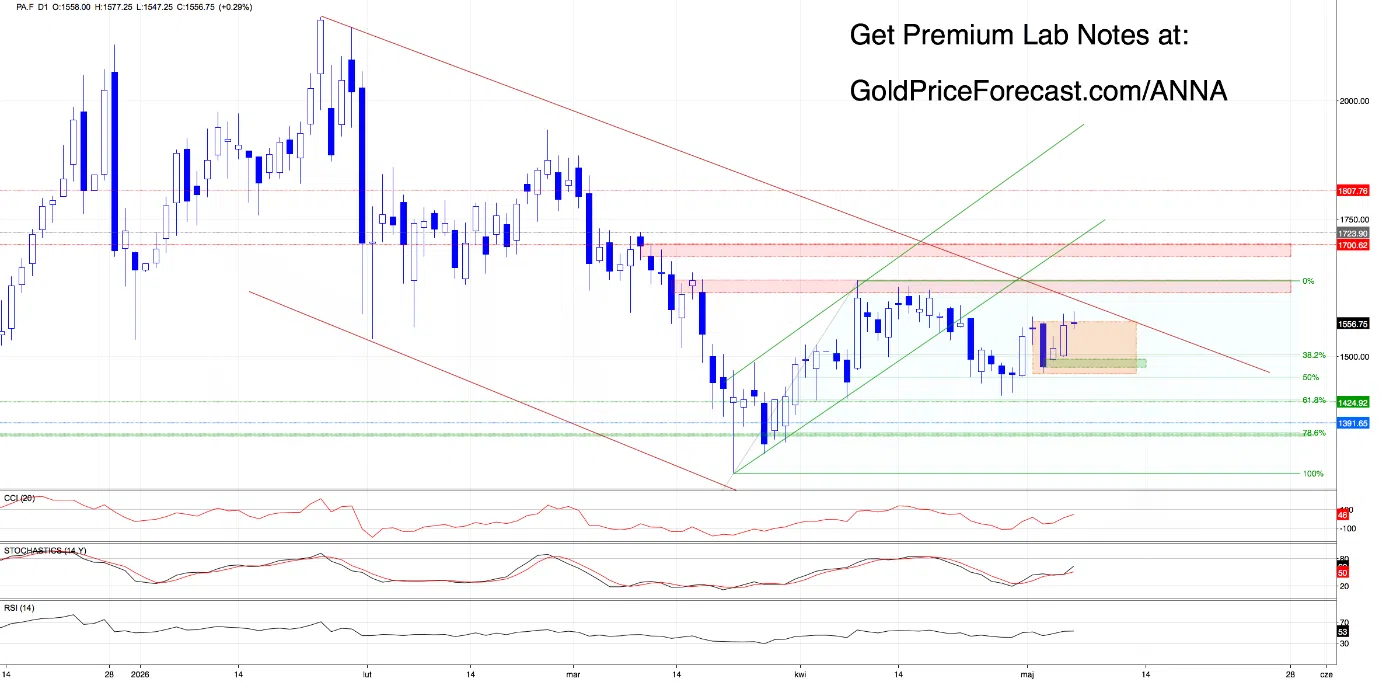
Compared to other metals, palladium shows much less precipitation.
Right now, the market is clearly struggling to break out of the orange consolidation range – possibly due to the nearby red resistance line sitting just above it.
That’s why, in our view, the path higher remains blocked until we see a daily close not only above the top of the consolidation, but also above that resistance line.
Until that happens, traders should prepare for more lateral movement inside the structure.
And what if the bulls start losing momentum?
Retesting the support zone based on the bullish divergence from May 5 between 1481 and 1494 becomes a very realistic possibility.
Main levels to watch:
Support: 1481-1494
Resistance: 1557/1600
today’s takeaway
If there’s one thing new traders should learn from today’s lab, it’s this: don’t just focus on direction. Pay attention to the reaction.
Many people look at a chart and immediately ask: “Is this bullish or bearish?” But experienced traders usually ask a different question first: “How is price reacting around key levels?” Because this is where the real information resides.
For dollars:
- A closer look at the bullish gap in March:
- Daily close below the gap -> 97.35 and chances of continuation towards 96.82-97.02 increase
- Successful defense of support -> could slow down metals and cause very short-term bounce in US dollar
- Island Reversal Remains Bearish Until Bulls Gain Bullish Momentum
- If you are trading metals today: Keep an eye on the dollar as a definite fall here could fuel a continuation of gold and silver.
For palladium:
- No confirmed breakout yet = no confirmation of continuation higher
- Look at the upper edge of the orange consolidation + nearby red resistance line
- Daily closing above both levels -> opens room for strong bullish move
- Failure to break higher -> increases chances to continue trading sideways or retest 1481-1494 support
At the moment, palladium remains the weakest looking metal in the group, so patience is more important than prediction here.
Quick update: If you’re also watching Silver and Platinum, I went one step further in today’s analysis for my premium readers and broke it down in detail, including the levels that could define the next move (+ All major levels + scenarios for gold). If you don’t want to miss out on it while it’s being built – not after it’s done – you can trial Premium Lab Notes free for 7 days here:
👉 Premium Access: Anna’s Trading Lab
Be patient, respect the levels and let the confirmations proceed.
Anna
Investorideas.com is the go-to platform for great investment ideas. From breaking stock news to top-rated investing podcasts, we cover it all.
Mining Stocks – Learn more about our news, PR and social media, podcasts and content services at Investorideas.com